How to Make Complex Images Accessible
Complex Images include graphs, charts, diagrams, maps, and illustrations. Below are 3 ways to provide alternative (alt) text-based on description for complex images, when a simple alt text attribute is insufficient. Choose the best alt text method for your image types.
For Web Pages: Your caption must be associated with the image, so make sure the to properly add a
caption using the 'figcaption' html tag (requires HTML editing).
Note: for MS Word and PowerPoint: Right click on the image and select Add Caption.
Example Code:
<figure><img src="images/fig9" alt="" width="160" height="120" />
<figcaption><em>Caption Goes Here, Fig.9-Graph..</em></figcaptions></figure>
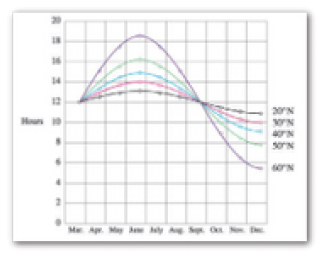
Fig.9 - Graph of the length of daylight from March through December at various latitudes.
For example, at 40 degree latitude there are 12 hours of daylight in March. In October,
there are about 10.8 hours of daylight at 40 degree.
If the image is adequately described in the surrounding text (including text-based data tables), so that the image is just reinforcing the text, no further description is needed.
Example:
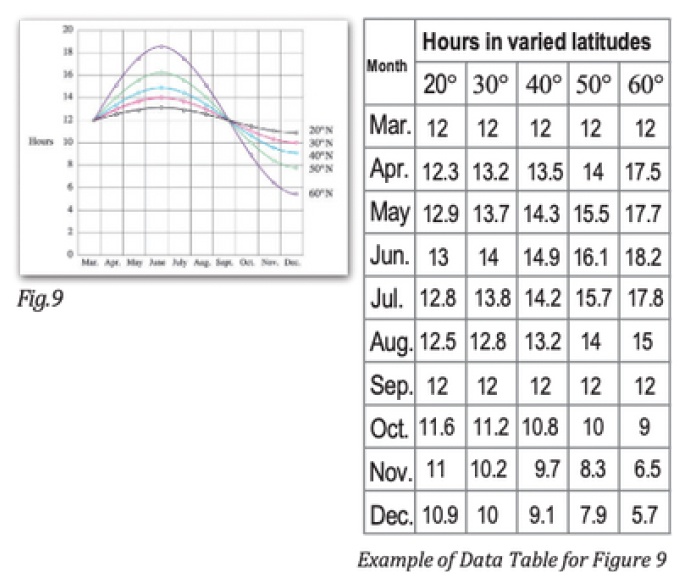
Modeling amount of daylight as a function of time of year, Figure 9 and the table beside it, show the number of hours daylight as functions of the time of year at several latitudes, From March though December.
If the image cannot be described using methods A or B, create a webpage that contains a longer description of the image. In the document, add the link to the long description.
Modeling amount of daylight as a function of time of year. Figure 9 shows graphs of the number of hours of daylight...
Provide a link to a webpage that contains the long description.
Sometimes touching a model or a tactile graphic is the best way to describe something.
Tactile Graphics
Tactile graphics have different size raised dots to show variation in graphs, charts and maps. Disability Services may have access to tactile graphics for your courses.
Example: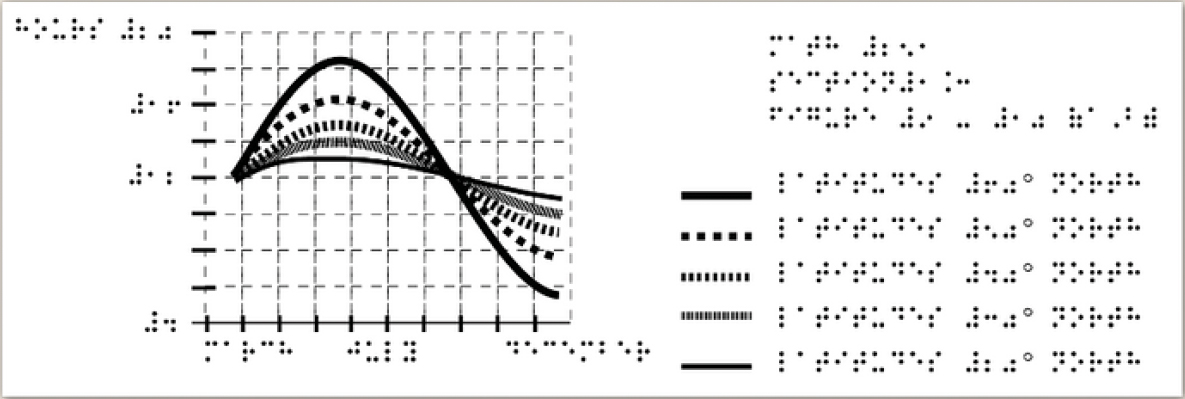
Indicate if the model is available
If you know were a 3D model of the image is available, indicate that in. your image caption or on the same page as the image.
Contact Us
Related Links
- Accessibility at Southwest
- Web Accessibility Guidelines
- Accessible eLearn Pages
- PowerPoint & Google Slides
- Microsoft Word & Google Docs
- PDFs
- Video & Audio
- Complex Imagery
- Math & Science
- 3rd Party Tools
- Accessibility Checkers
- Accessibility Responsibility
- Software Purchases
- Accessibility Plan
- Accessibility Training Resources